Stone Labs Ranking High on Clutch

Stone Labs is committed to helping any business with our IT Consultancy and Custom Solution Development. We do specialize in helping sports and travel companies, but give us a problem that needs to be solved with technology, and we’ll build a solution. Our solutions help improve sports results across several different athletic realms. We like focusing on the sports industry, because according to this article, it’s a $1.3 trillion industry!


We know our technology development helps our clients improve their businesses and organizations, and we wanted a way for our clients to share their success with Stone Labs to all who are seeking help. That’s why we’ve joined Clutch!

Clutch is a rating and review website for development companies and other business service firms. Clutch ranks companies based on the client reviews they collect. The reviews are gathered by a 10-15 minute phone call and are packed with so much information about the project that was done for the client. So far, we’ve got two reviews on our Clutch profile as we only have recently joined their platform! That being said, these two were great case-study style reviews and we are so excited to have them on Clutch. Our most recent reviewer, the CEO of a POS company had some great things to say about our commitment to his project. He said,

“They were willing to work overtime if necessary.”

And went on to say,

“They were very dedicated and reachable.”

Another reviewer, a project manager at a sports training company, was really happy with how we operated and dealt with him as a customer. He said,

“Their business administration, project management, and communication are a breath of fresh air.”

As said before, we’re relatively new to Clutch’s platform, but we plan to get more of these quality reviews through their website in the near future. Even with only two reviews on Clutch we already rank on the 4nd of out of over 59 developers on their directory of top development companies in Lithuania.

If you’re interested in having Stone Labs build you an awesome IT solution or web platform, we encourage you to go on our website to read our previous projects and check out the work we’ve done for our satisfied clients. Of course, also check out our Clutch profile.

Mobile App developers or Retail business doesn’t need an app.

So, you’ve made it. You’ve given up to the tension of hundred market analysts, bloggers, friends, grannies, and finally launched your app. You found some application you wanted yours to look like, you asked for everyone’s advice and ta-da, you’re a happy owner of a parking space on AppStore! You even have your budget planned for constant financial injections in app promotion, as your friends advised you. But those 2 new teenagers who did buy sunglasses on the app is not completely the new-market and unprecedented-business-growth result you were promised to obtain. What’s wrong here?

The thing is that everybody knows that he needs an app, but very rarely one has a very clear idea of why he needs this. I say that because almost every week we have a new guy who wants to develop another app for his business or ego. When we ask what his business development model for the app looks like, the answer is usually something like “My competitor has one am I worse than him? ”, which is as strange as If I’d buy a suspension spring because my neighbour has bought one, though he has a Ford Mustang and I have a horse. Of course, as for a mobile developer, such approach is a real bonanza, but my reason cannot accept that. That’s why I came up with the idea of the PRESUMPTION OF UNNECESSITY.

What does it mean? It means that as a retailer, you, presumably, don’t need an app. Merchants on 17th-century Jamaica sold rum without having even a website. If one has a product that is in real demand, he/she will sell it even if their store’s technology level got stuck in the Stone Age. And unless you’re a Starbucks, with an army of Internet geeks as clients, who take shower with their iPhones, or an Amazon, with 237 mln users, where even by law of large numbers there must be people who are used to shopping from mobile, you are likely to face a lot of difficulties to make the folks around shop through your app. Especially if you’re an offline store with a really motley auditory. For the money you spend on app promotion you can hold an extra Black Friday and earn 5 times more than in a year of the app support. And if you have an online-shop already and want to try selling mobile, being inspired by the growing mobile sales numbers, why not starting with a mobile website? It’s cheaper, it’s already cross-platform. Of course it has a lot of problems as poor design and complete Internet-dependence, but you can check the trend with it at least, and decide where to move further. If you don’t have an online-shopping website, app is also useless in most cases. An app needs a constant product database updates online, and if you put one online, first at least try with a website, it’s much cheaper. Then, you’ll see the further steps yourself.

So, am I going to quit the mobile app development sales job and that’s why I criticize the mobile apps for retail? Are the money your partner assigned for a mobile app a waste of resources? No. While the argument of converting a mobile app into one more shopping place for your customers still seems a bit risky, mobile app can be good in other major things:

– Client retention

– Brand building.

Client retention.

Nobody can better remind your client about you than somebody who spends all the time with him or her. And if you don’t have your client’s spouse or child as your secret agent to tell your brand’s name 3 times a day during a meal, you can turn to a mobile phone. The only thing I have with me more often than a mobile phone is my own body, but unfortunately for you as a retailer, you can’t influence the latter. Meanwhile the former is waiting for you to use it. Push-notifications, iBeacon, even light being on your side, you can always keep your client up to visit you. But the most efficient instrument here is discounts. Can I be a happier client if my app constantly offers me how to save money on something? Having launched our iDiscount (or Eskidki- locally) app for one of local retail chains, we saw it ourselves: we can save a fortune if have our app turned on and everyday updates for different kinds of products sales popping up on our phones. All I need is to activate an offer and have the discounted goods on my hands.

What’s good about that is that you get your clients addicted to your app. Which means that one day you can put anything additional in the app, and they will use it. If you have your clients used to your discount purchases app, you’ll easily transit them to regular purchases from the very smartphone: – they’ll just loose interest in shopping any way else.

Brand building.

It’s very obvious and banal, but take a look at Red Bull. Have anyone once seen and app selling their drinks? NO… Now look here: it has 1 – 5 mln downloads. Theoretically, everyday around 3 mln people get the “Red Bull” lettering in front of their eyes. You’d say that Red Bull is a very different story, and everybody knows without an app that Red Bull is Active Sports. But ok, check out the gorgeous Chipotle’s Scarecrow. The game makes people think of Chipotle’s brand while having time of their lives saving the world from modified food. What’s more important, Chipotle becomes associated with naturality for those app users. It’s just a matter of fantasy, that’s all. And here the mobile technologies are your best friends too.

So, summing it all up, this post is not aimed to make you give up on the app for your retail business. Mobile e-commerce is boosting immensely and you certainly need to be in this train with other successful businesses. See H&M,Forever 21Zara, which are enormously popular. But please have the strategy for your app. Why is it so important for us as a simple mobile and web solution company? During our 8 years of experience we’ve seen something and we have something to advise too. But it’s much easier to provide some quality solution if we know what it is for and how it is going to work.

Time and budget saver for outlet inspection

Is it possible to save up to 67% of the budget allocated for outlet inspection? We give a positive answer as it was proved by our project.

An international tobacco company is suffering from a disorganized inspection process, which implies hiring a large number of outlet agents to collect information about each outlet where its production is sold. Outlet agents get a special paper form to find out about the sales result, the placement of the product, the condition of the shop etc. They spend about an hour to inspect one shop (4-5 shops a day) and then they have to come back to the office and type in the information on the computer which takes them about a half an hour more (per shop).

Why do they double their work by filling in paper forms and writing reports? Is it possible to do it 2-3 times faster? Well, the solution that we have provided helps to save approximately one hour on inspecting and describing just one shop.

How did we do that?

We suggested creating an application for the special corporate smartphones being used by the agents, which would allow to input the information being inside the shop. The application eases the data collecting process providing special intelligent templates with forms to fill in and lists to choose from. Every template is generated automatically, depending on the type of the store. The data is collected and sent to the backend in a format, that requires no additional preparation.

The application structures the information and the outlet agents are able to adjust the form and the questions to the outlet chosen. When the work is done, all the gathered information is sent to the cloud database for further analysis and decision making. It is also possible to take some photos and attach them to the form.

Voila!

The solution was found and now let’s take a close look at the process from the beginning till the end.

Step 1

The first meeting where our business analyst was discussing the task and deadlines with the company’s officials showed that a lot of work should be done to clear the goals and get the right understanding of the working process. Our expert had to interview all the stakeholders to get a clear idea of the working process and was able to find some problem areas in it, then the business vision was formulated.

There were quite a lot of stakeholders in the system (sales department managers, IT department managers, outlet agents) and our first aim was to meet all their requirements although they sometimes contradicted one another. Eventually, we were able to find the best solution that turned to be the most effective and suited everyone.
Business Analyst

Step 2

When the business vision was approved, to integrate the application with the existing IT backend infrastructure, our team also held the investigation of the existing architecture design and consultations with the client side tech teams.

The main challenge for the technical team was to find a balance between supporting old IT systems of the company and implementing new technologies in developing mobile applications. We have managed to do that by using a distributed application structure
Tech Lead

Step 3

Having sketched the future User Experience (UX) and User Interface (UI), the team of the business analyst and the UI designer set up the UX prototype to present to the stakeholder’s board for intermediate review and feedback. Already at the prototyping stage, the team showed the inclination to combine the best practices of Android Guidelines (for that period of time) with taking into account the collected preferences of the potential users. Due to it, the subsequent presentation showed the UX prototype met almost all the stakeholders’ requirements, so after several minor changes, the UX project was approved.

Step 4

Basing on the approved UX project, and the results of steps 1 and 2, the business analyst started to compile the specification that would cover all the aspects of the application functioning, in terms of user experience, integration with the existing infrastructure, and meeting the business goals. When ready, we presented the specification to the client, to make sure our vision on the details of application functioning was still in line with the ones of the client’s.

Step 5

After this, the UI designer started to work on the final version of the design: he drew the ready-to-market UI, taking into account the peculiarities of the client’s unified smartphones model range (every outlet agent used a smartphone of the same model); introduced the traits of the company’s corporate style; and created the screen compilation for the developers. The final design also went through the procedure of approval, which we got having covered a couple of corporate style preferences. Afterwards, our team proceeded to development.

Step 6

The application development process took about 1.5 months and was carried out by using the waterfall model with the clearly defined scope and deliverables to meet the company’s needs. The reporting process consisted of a report and a collective phone call twice a week, and a weekly on-site meeting with the product owner. The quality assurance was included into the process as well.

Step 7

The application was tested on a small area and some features for better usability were implemented. After that, the application was successfully released.

Conclusion

The application we have created for special corporate smartphones (used by outlet agents) makes the data collecting process much easier by providing templates with forms to fill in and lists to choose from. As a result, the outlet agents do not waste time on writing reports, so they are able to inspect more retail outlets. This helps to save about 62 500 dollars per year. Moreover, all the information collected is saved in the cloud database just after the outlet has been inspected.

Data analysis in forecasting sales and schedules for drug stores

A data scientist, according to Harvard Business Review, is “the sexiest job of the 21st century”, and it’s pure magic when you see how all these raw data are turned into a clear prediction with definite figures.

In this article, we’re going to show you the magical process of predicting sales step-by-step. It started when we got an idea to take part in a Kaggle competition for data scientists. The task was to help poor Rossmann store managers create effective schedules for their employees, basing on the predicted sales and the average check. Here we have to say some words about Rossmann stores. Rossmann is the second largest drugstore chain in Germany, founded in 1972 by Dirk Rossmann. It operates over 3,000 drug stores in 7 European countries and employs more than 28,000 people. Rossmann offers over 17,500 different items in its biggest retail outlets. Besides the pharmaceutical goods, you can also find pet food, a big choice of different wines, toys and stationery as well.

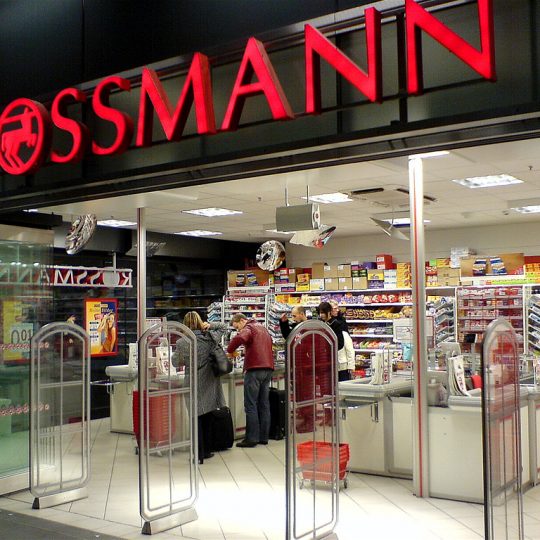
The photo Rossmann Innenansicht eines Ladens by Jan Hagelskamp1 is licensed under CC-BY 4.0

Before getting the solution, Rossmann store managers had to predict the daily sales and the number of customers for up to six weeks in advance; while store sales, in their turn, can be influenced by many factors, such as promotions, competitors in the area, school and state holidays, seasonality, and locality. As there were thousands of individual managers to predict sales based on their unique sets of circumstances, the accuracy of such forecasts was rather varied. Therefore, the task was to make a reliable sales forecast (including the number of customers and the average check) for 1,115 stores across Germany using which Rossmann store managers would be able to create effective staff schedules to increase their productivity and motivation.

Step 1 We were provided with historical sales data for 1,115 Rossmann stores. The data were provided in the CSV format, the selection contained 15 attributes, such as customers, assortment, store type, state holiday, sales etc.) We added attributes DAY and MONTH extracted from the data given (based on the timestamp). For the following hypotheses check we excluded the attributes, influence of which was obvious, e.g. if the store was open or closed on a particular weekday. As a result, every attribute left in the selection, made a hypothesis on whether this single attribute influences the number of customers and the average check.

Despite the fact we got the structured data, we used complex algorithms of data processing, as we had to carry out a large number of transactions.

Data scientist

Taking this into account, we proceeded to the next step – checking the hypotheses.

Step 2 We visualized the hypotheses, based on the attributes chosen, and made a conclusion that some of them did not influence the result, so they were excluded from the selection (e.g. On the other side, some hypotheses required the introduction of other parameters to get more accurate results. For instance, when we visualized the attribute STORE (all shops data), we got the data which showed that on Sunday Rossmann shops were attended by fewer customers than on the other days. However, when we included the attribute OPEN, it turned out that only a few shops were open on Sundays, and they were visited by a bigger number of customers than on weekdays. However, the average check was lower.

The graph shows how promo offers influence the sales

Based on the examples described above, we made a conclusion that not all the given attributes influence the sales equally, so we made some corrections (added and excluded some attributes) and finally got 4 attributes which influenced the sales significantly. They were:

  • promo – indicates whether a store is running a promo on that day;
  • year/week- describes the year and calendar week;
  • state holiday – indicates a state holiday;
  • annual sales increase – shows how the sales increase each year.

When we were checking the hypotheses, we found quite a number of interesting facts and correlations which are not directly related to this task, but might be used by Rossmann marketing department.

Business analyst

The graphs show how different holidays influence the number of customers and the average check

Step 3 Our next step was to choose a model type. At first, we tried a model of linear regression but it didn’t work out as it had a margin of error of 40%. Then we tried a model of a decision tree, however, the result was still inaccurate, so it ended up with a model of a decision forest which suited well for our type of data and the task given.

Step 4 The model was built and trained (here we used a scikit-learn library) and we had to make some adjustments in order to improve its training result and thus to increase its accuracy. To increase the accuracy, we had to change the model we trained. We could do it by using lognormal distribution instead of a usual one to get the required accuracy. With the adjustments described above, we got a result of 88% accuracy, which we found satisfactory for that very business task, while could see the ways of further improvement.

Acquiring the required accuracy is a time consuming process, as it is always necessary to optimize a machine learning algorithm and check the result. Although we have reached 88% accuracy, the result can be improved if there is more time.

Data scientist

As a result, we have created a model, using which Rossmann store directors can predict sales for 6 weeks in advance (due to the number of customers and the average check).

Following on from this prediction they will be able to create an effective schedule for their employees.

The graph shows the difference between the actual sales and the predicted ones for a selected calendar month

Our next step might be the creation of a visual interface for predicting sales, so it will be possible to enter a random weekday e.g. the first Tuesday of June 2017 and predict how many customers will attend the exact store and how much money they will spend there.